
Structural liquidity in trading is one of the most important concepts in Smart Money and price action trading. It explains why price often pulls back against the trend, where stop losses accumulate, and how the market uses market structure itself to collect liquidity before continuing the move.
This guide explains structural liquidity in a clear, practical way and shows how higher‑timeframe trends use lower‑timeframe structures as liquidity targets.
What Is Structural Liquidity?
Structural liquidity in trading refers to liquidity that is formed by market structure itself — higher highs, higher lows, lower highs, and lower lows across different timeframes.
When price moves in one direction following a clear structure, traders who enter in the direction of the trend place their stop losses in predictable locations. These stop losses become liquidity.
At some point, price returns to these structural levels, collects that liquidity, and then continues its primary move.
In simple terms:
Liquidity Collection Through Market Structure
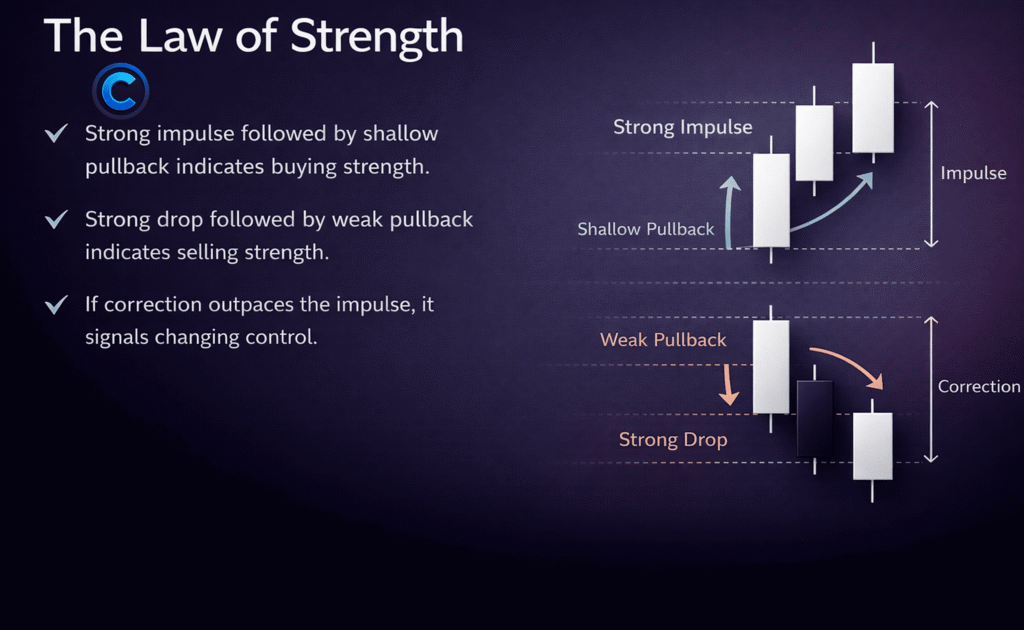
When price moves according to structure in one direction, liquidity is left behind by traders following that move. The market does not move randomly — it often retraces specifically to remove that liquidity.
After liquidity is taken, price typically resumes the original direction.
This behavior explains why pullbacks happen even in strong trends.
Structural Liquidity vs. Liquidation Cascades
Structural liquidity in trading can look similar to liquidation cascades, but there is an important difference.
In structural liquidity:
- The higher‑timeframe trend remains intact
- The lower‑timeframe structure temporarily shifts
- Price returns to collect liquidity
- The main trend continues

This diagram shows a higher‑timeframe bullish structure where price temporarily breaks local structure, returns to collect liquidity, and then continues upward with renewed strength.
Lower Timeframe Structure as Liquidity for Higher Timeframe Moves
One of the most important principles of structural liquidity in trading is that lower timeframe highs and lows act as liquidity for higher timeframe structure.
What looks like a valid structure on a lower timeframe often becomes a liquidity target on a higher timeframe.
For the best chart analysis experience, open these structures directly on TradingView.

In this example:
- Lower‑timeframe highs and lows form local structures
- These structures attract traders
- Their stop losses become liquidity
- The higher‑timeframe move later collects this liquidity
This is why price often revisits areas that look “clean” or “obvious” on smaller timeframes.
Other Forms of Structural Liquidity
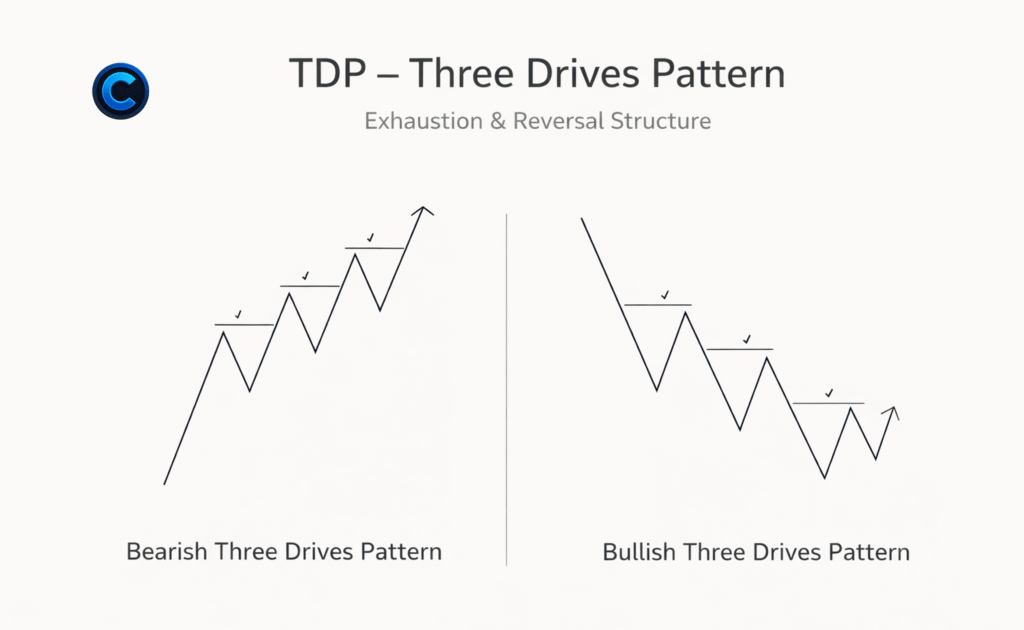
Structural liquidity in trading does not appear in only one form. It can develop in multiple structural patterns.

This formation shows liquidity building through repeated structural reactions rather than a single clear range.

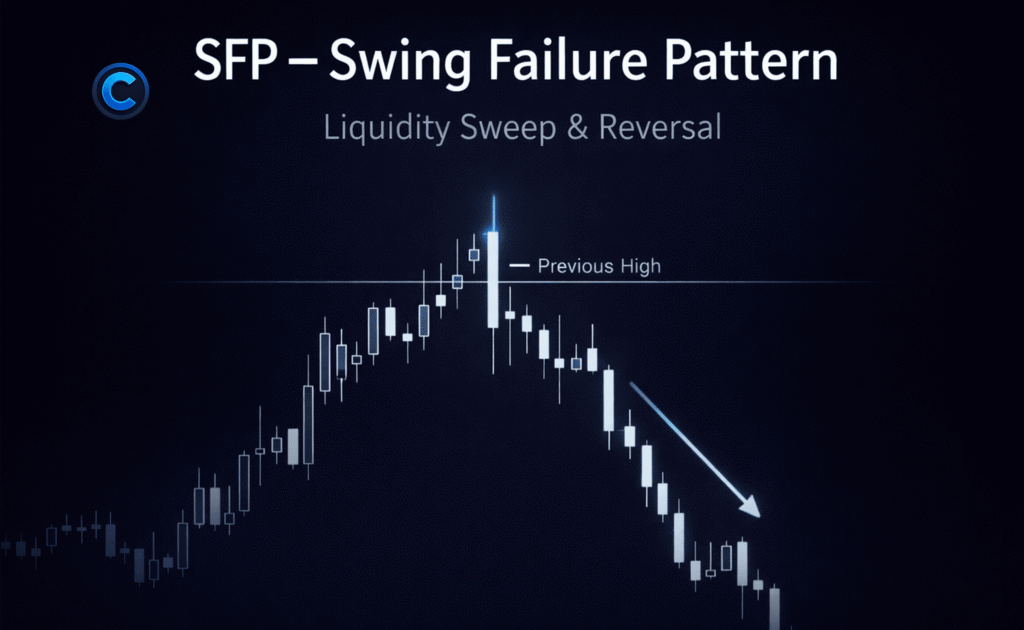
Here, descending highs create liquidity above price. When that liquidity is taken, the market reacts strongly.

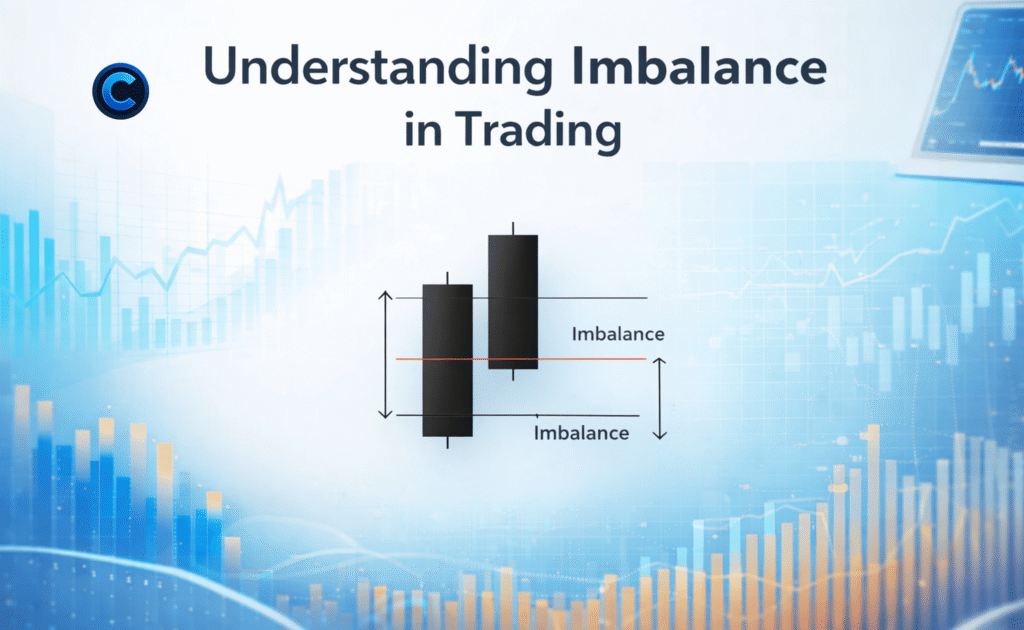
In consolidations, repeated highs and lows form dense liquidity zones that often fuel the next expansion.
Key Principles of Structural Liquidity
Understanding structural liquidity in trading requires a shift in mindset. Liquidity is not an entry signal — it is a target.
Liquidity: Key Takeaways
- Liquidity acts as a magnet — price moves from one liquidity pool to another.
- Liquidity is not a precise entry level, but a destination price may seek.
- The more liquidity builds in a zone, the higher the probability price will move there.
- Liquidity taken below market price can signal a potential bullish reversal.
- Liquidity taken above market price can signal a potential bearish reversal.
- Gradual liquidity accumulation along a trend can lead to a liquidation cascade when the trend breaks.
- Trend comes first — liquidity comes second.
- Liquidity does not always need to be fully collected.
How to Use Structural Liquidity in Trading
Structural liquidity should always be used in context, never in isolation.
Best practices include:
- Identify the higher‑timeframe trend first
- Mark structural highs and lows on lower timeframes
- Expect liquidity pulls, not straight‑line moves
- Wait for confirmation after liquidity is taken
- Combine with market structure shifts or displacement
Traders who understand structural liquidity in trading stop chasing price and instead anticipate where price is likely to go next.
Final Thoughts
Structural liquidity explains why price often retraces, why false breakouts happen, and why obvious levels get swept.
By learning to read liquidity through structure, traders gain a deeper understanding of market behavior and align themselves with Smart Money rather than fighting it.
Structural liquidity is not about predicting exact entries — it is about understanding intent.
Related Guide:
Liquidity in Trading: The Concept of Market Liquidity Explained